Recap
The third quarter brought back volatility after a first half rebound, with stocks and many bonds giving up some, and in many cases, all year-to-date gains. Pain came towards the second half of the quarter, post-earnings season. This recalls a common refrain from a mentor and former colleague who would quip in various ways at the start of any quarter that the best time for stocks was when focus was on fundamentals and actual reported earnings. Market attention wanders toward other headlines thereafter, and not always for the better. Politics and geopolitics aside, much of the quarter’s volatility stemmed from market interpretation of economic data and the potential impact on interest rates. Last year, the Fed surprised everyone, including themselves, by the scope (from 0 to 4.25%) and swiftness of hikes. This year brought another 1%, but the pace is slowing.
The back and forth on inflation, recession, soft-landing, and no landing is constant. Often in such environments, bad news is good and good news is bad, so an employment number can be seen as good (employers are hiring despite rising wages and costs) and bad (potential for more inflation and even higher interest rates).
The bad, from a market perspective, is that if inflation remains stubborn, the Fed can keep moving (short-term / Fed Funds) rates higher, directly translating to bond weakness (yields up, prices down) and equity headwinds. Why? Higher rates increase the cost of borrowing for companies while also lowering future cash flows. But there is the flip side to this argument which we think is good long-term.
The Other Side of Rising Rates
There is now real money to be made in saving (“real” meaning a return above inflation). Despite a few positive bouts over the last 20 years, the last time money market yields exceeded inflation was in the mid-to-late 1990s. Bonds offered a bit more over this time, but with yields on core taxable bonds now rising to roughly 5.5% (on Bloomberg Aggregative Bond Index), the prospects for nominal and real returns are improving.
For many who have only started investing in the last 20 years, this change may seem off or anomalous. We had near-zero rates in the U.S. and even negative yields overseas, but that was the real anomaly. Up until the Financial Crisis, investors and savers expected to make money on their cash. During the 20th century, cash annualized 1% above inflation and treasuries offered another 1.5% on top of that. Even in the high inflation environment of the 1970s (annualized inflation of 7.4%), cash yields were also in the 7% territory. In other words, rates at this level are a lot more normal than not. Another colleague often refers to the world of investing as a combination of owners (stocks, real estate, cash generating assets), loaners (municipal bonds, loans, T-bills, mortgage-backed-securities), and hoarders (commodities, collectibles, cars, etc.). A low interest rate environment punished the loaners and benefited the others. Since most of our portfolios have an allocation to fixed income, making money as a loaner is a welcome development.
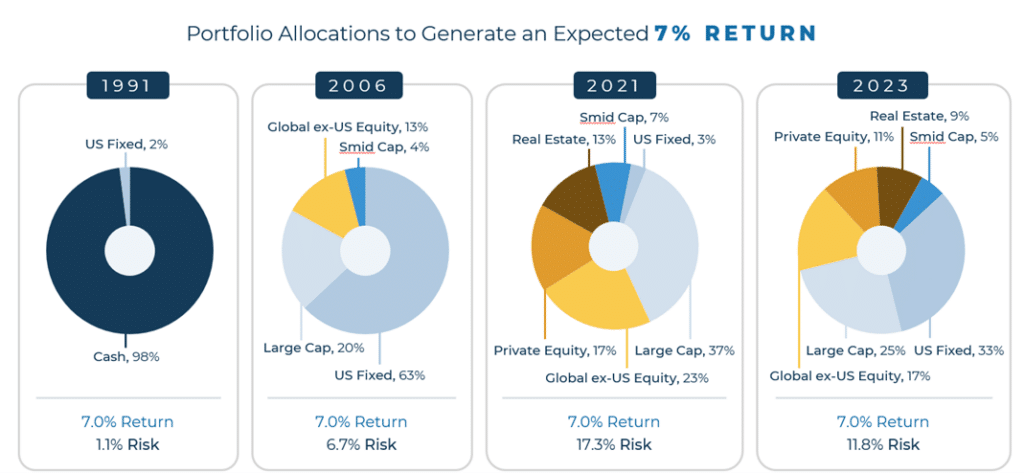
We share the chart below occasionally to reflect the level of complexity and risk clients may need to consider taking to reach a 7% annual expected return. Our friends at Callan regularly update this work. It is based on their own capital market assumption data which goes back several decades. Their recent numbers are not materially different from our own and provide helpful context. At the beginning of 2023, Callan projected that a client could have a roughly 33% allocation to fixed income and still reach a 7% return. Back in 2008, one could own almost 50% fixed income, and in 1991, 97% fixed income, to reach the same 7%. A stark contrast to the 2021 numbers below, when one had to take on significantly more risk.

Source: Callan
The Other, Other Side of Rising Rates
Savers might be reaping benefits, but there is always a trade-off. Headlines are all over this, with higher borrowing costs hitting companies, consumers, and governments alike. This is a tangible dynamic, and one that will provide a cap on the good times savers are having today. So, why haven’t higher rates translated to an immediate economic slowdown? It’s because the consumer and corporate America still have a decent financial foundation.
First, the consumer. The effective rate of outstanding mortgages is around 3.6%, a far cry from the near-8% rate for a new mortgage. As we all observe today, if everyone is locked into a 30-year mortgage, what does a change in interest rate do to your expense next month? Not much. Since mortgages make up 66% of consumer debt, and 40% of homeowners are mortgage-free, rising rates are yet to take a bite. In fact, debt service (a.k.a. monthly debt payments) as percent of disposable income is still below 10% (it spent the 1980s and 1990s at 10-13%).[i]
Second, corporate America. There is a presumption that higher rates are structurally bad for companies. Yes, banks are struggling to reconcile low-rate, long-dated loans with depositors requiring higher yields. Many other companies, however, are sitting on high levels of cash which is no longer punitive. In fact, net interest expenses (interest expense on debt less interest income on assets and securities) outside of banks are actually down since the Fed hikes started. Also, unlike the U.S. government, which arguably didn’t use the zero-interest rate policy (ZIRP) environment wisely to push out the maturities of their ever-expanding spend, corporate America did. In fact, in reviewing high-yield corporate debt, more than 70% was issued when the Fed Funds rate was below 1% and less than 5% when the Fed Funds rate was above 3% (it’s 5.5% now).[ii] The maturities were also pushed out with less than $350 billion of the over three trillion maturing before 2025 (the largest calendar cohorts are 2028 and beyond).
Now What?
All this context in place, investors may look at their bond portfolio over the past few years (2022 in particular) and see some significant pain which has translated to very muted (and in some cases near-zero) returns over longer horizons. We often talk about long-term returns for investment-grade bonds reflecting the starting yields. Over time, we see returns over a 10-year period within +/- 1% of the starting yield. At the start of 2012, bonds were yielding approximately 1.75%; 10 years later, and even after the worst bond market rout in U.S. history, they annualized a little over 1%. Obviously disappointing, but still better than cash over that period and still within 1% of the starting yield. We say that today because yields are now 5.5% on those same bonds, the highest in more than 15 years. Regardless of the direction of interest rates, over the long horizon, investors should expect to be close to that level within a reasonable range.
One positive thing about bonds is that, absent a default or being an unlucky European who bought bonds with a negative yield, one should expect positive returns over the life of the bond. The volatility will impact prices in the short term, but the coupon more than offsets that over the long term.
In April 2021 (well before the Fed started to hike rates), we shared our thoughts on “Fixed Income Investing in a Rising Rate Environment”. We highly recommend that those who are interested in learning how interest rates impact a bond position read that piece. It walks through the basics of bonds in a rising rate environment, as well as the benefits of rates rising quickly rather than over time. The punchline was and is that as long as one’s investment horizon is longer than the duration of their fixed income portfolio, they should be happy with rates rising, as this translates to higher expected returns going forward.
Markets

Source: Morningstar and Bloomberg Finance L.P. (data as of 9/30/2023)
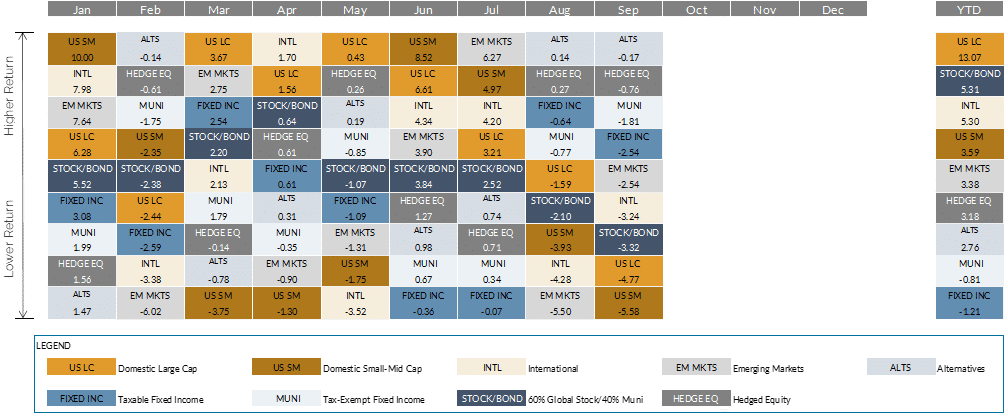
- U.S. equities gave back a good portion of their positive returns in Q3 (S&P 500 -3.3%, Russell 2500 -4.8%), as markets digested moderating earnings, a rebound in interest rates, and a new wave of geopolitical concerns. For the year, the newly billed Magnificent Seven (Apple, Microsoft, Nvidia, Amazon, Meta, Alphabet, and Tesla) continue to lead, and anyone without material exposure lagged. That means that at least in the U.S., growth remains ahead of value year-to-date, with dividend payers struggling the most in a more competitive yield environment. As an aside, the Magnificent Seven is a somewhat ominous name for any subset of companies or any other group. In the original film (and the Seven Samurai film it was based on), only three survive the last battle. Whoever coined that term to reflect bullishness may want to pick another moniker.
- With none of the Magnificent Seven overseas, non-U.S. markets both developed and emerging were also down for the quarter (developed -2.9%, emerging -4.0%). For the year, and contrasting to the U.S., markets are being led higher by value stocks. In fact, since the start of the pandemic in 2020, value is actually beating growth overseas.
- Despite a benign third quarter, China continues to be one of the main laggards abroad year-to-date (-7.2%), with reopening hiccups translating to weakness not only in Chinese companies, but also those with material China sales exposure.
- Most bond markets fell in Q3, largely in September, when interest rates on the longer end of the curve jumped. The 10-year treasury closed the quarter at 4.6%, breaching the 4.25% peak of Q4 2022. Investment-grade taxable and tax-exempt bonds fell 2.5-3.5% in Q3 and are now slightly down for the year. The Federal Reserve raised interest rates by 0.25% in July, but has since kept them unchanged, with guidance of potentially one more hike this year and a pause thereafter. The broader move of rates higher coincided with further optimism from market participants of a soft to no landing in 2024, which would translate to the Fed only cutting rates marginally next year. The inflation picture, although improving (down to 3.7% YoY), still remains stubbornly above the Fed target, which also translates to a more hawkish fed. Despite the move, higher yielding strategies continued to perform well during the quarter and year-to-date. Spreads are now back to levels last seen before the regional banking crisis that began in March. Corporate balance sheets remained relatively strong despite some uptick in default rates.
- Alternative investments held up well in Q3, with those overweight credit and underweight net long equity exposure leading returns. Absolute return and other non-correlated strategies held up well. Commodities, although still down YTD, rebounded in Q3 thanks to rising oil prices.
[i] Source: Bloomberg Finance L.P.
[ii] Source: Bloomberg Finance L.P.; Blackrock


2024 1st Quarter Commentary: “In a world drenched in pessimism, it pays to be optimistic.”
With so much emphasis placed on negative headlines, negative developments globally, and the ability to embrace one’s inner negativity, it ...