Throughout this year, we have spent significant time discussing inflation and the Federal Reserve, so we felt it was important to pivot towards the story in financial markets for 2022, which begins and ends with fixed income. The headline grabbing 2.50-4.50% rise in interest rates corresponded with a decline of 7% to 15% in value for bonds, depending on particulars. We have come to expect the losses we saw in the equity markets (down 9% to 35%, again depending on the specifics), but losses in fixed income were historic and led to similarly historic declines in any balanced equity/fixed income portfolio. Perhaps the starkest statistic showing just how rare 2022 was, was that since 1936, there has only been one other year in which both stocks and bonds were negative, and in that year, 1969, stocks were only down 8.4% and bonds only 0.74%.
The primary reason for fixed income’s declines was the continued rise in inflation, its evolution from transitory to more ingrained, and the Federal Reserve’s sprint to raise rates to try and reign it in. A compounding factor, and a point we have made repeatedly, was that at the yields found in the fixed income markets at the beginning of the year, there was little buffer to the impact of a rise in rates.[1] Now with yields up and interest rate duration down, the Bloomberg Aggregate fixed income index, the most frequently cited index, is able to withstand a much greater move in rates and still generate a flat to positive return moving forward one year. More specifically, a 0.75% move up in rates at the beginning of 2022 would have resulted in a decline of -3.30% in the index. At current levels, the index would be flat.
Much ink has been spilled of late with articles bemoaning the death of the 60/40 portfolio and similar equity/fixed income balanced portfolios. We would say this is too backward biased. As we have pointed out, the path of recent market performance sets the stage for future performance, usually momentum in the opposite direction, or “mean reversion” in finance speak. 2022’s poor performance left equity valuations and fixed income yields much more conducive to future performance. All else equal, lower equity valuations and higher fixed income yields should result in more robust future performance than the opposite.
See below for a scatter plot of quarter-end S&P 500 price/earnings levels going back to 1990 and yield-to-worst of the Bloomberg Aggregate Bond Index. For the avoidance of doubt, an investor ideally would be facing levels in the upper left quadrant (low valuations and high yields).
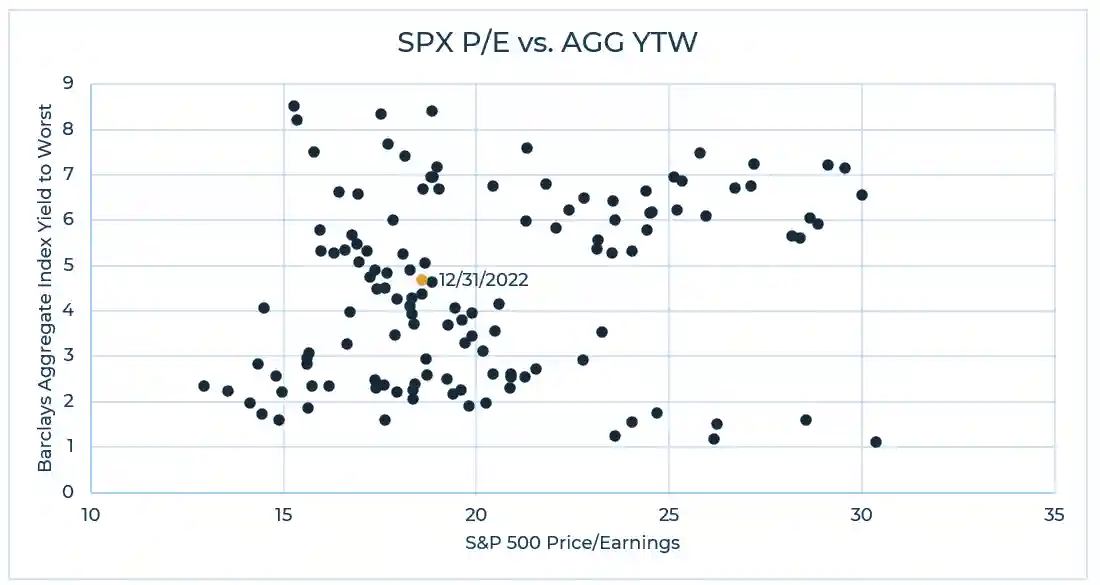
In the recent past, we have bumped along in the lower right quadrant: equity valuations had rarely been higher and yields on the Bloomberg Agg index had never been lower. Where do you allocate if everything is expensive? The investment community in fact coined a somewhat depressing term reflecting this dilemma, “There is No Alternative” or TINA. We did our best to set (conservative) expectations, using the lowest capital markets assumptions we had ever used in our financial plans. We are now sitting decidedly in historically normal levels, and as a result we are in a much better starting point than we have been in a long time, also reflected in our more optimistic capital markets assumptions currently in use. We do not think the 60/40 portfolio is dead.
Equities
In our last year-end commentary, we repeated our refrain to stay balanced across growth and value exposures and to continue to have non-U.S. equity exposure. While being concentrated in U.S. growth stocks was the correct “trade” for the last number of years, 2022 rewarded those who kept a more balanced allocation, with U.S. value stocks outperforming growth stocks by the second largest margin since 1980 (-10% vs. -30%). And after underperforming U.S. stocks for the better part of 2022, the last two months have seen international stocks move ahead of U.S. stocks for the year.
Looking forward, we continue to feel that the absolute level of value vs. growth and U.S. vs. international in one’s portfolio is less important than one having material exposure to each. We also recognize that there are switching costs associated with re-allocating (taxes being a main consideration) that may not be offset by any assumed uptick in expected returns. For those anchored to the “U.S. growth” story of the last ten years, we would simply offer the following: many structural reasons support value stocks over growth, namely higher interest rates, higher inflation, and onshoring of supply chains. Further, periods in which value outperforms or growth outperforms typically play out over years, not a single calendar year. With respect to international investing, as has been the case for years, providers of Capital Markets Assumptions (CMAs) are once again predicting non-U.S. stocks outperforming U.S. stocks by multiple percentage points per year over a long-term horizon. Historically, relative valuation disparity drove most of the prediction for international stocks outperforming. Add to that what likely is now relative U.S. dollar weakness vs. other major currencies and some significant cost advantages vs. the U.S., and international stocks likely enjoy many tailwinds.
Fixed Income
As we stated at the beginning of this commentary, fixed income markets provided the real fireworks in 2022, upending decades of trends and expectations. The Bloomberg Aggregate index’s -13% return for the year dwarfs the next previous largest calendar loss since its inception in 1976 (1994’s -2.92%). While we had larger absolute moves in interest rates than we saw this year, we haven’t had such moves in the context of starting yields as low as they were coming in to 2022. Given the fixed income story was really an interest rates one, and not one based on growing concerns over credit quality, more credit-sensitive fixed income asset classes outperformed, with high yield down 11% and leveraged loans down 1% (owing to their floating rate nature and thus limited interest rate risk). Even municipal bonds significantly outperformed the Bloomberg Aggregate index, clocking in with a roughly 5% decline for the year.
We often illustrate the very strong relationship between starting yields on fixed income and subsequent long-term total returns of the asset class. Assuming that continues, we expect stronger returns going forward for your fixed income portfolio. We were struck when looking at some of the year-end CMAs published recently and the change from year-end 2021. One of the firms publishing its CMAs the longest is JP Morgan. Last year, owing to the stretched valuations observed at that time, they were estimating long term U.S. equity returns in the low 4%. Fast forward a year and they are now predicting core, investment grade, boring fixed income returns to be in the mid-4%s, so greater than what equities were predicted to return just a year ago.
Other Asset Classes and Exposures
Private Equity
Private equity groups a few disparate strategies under the same umbrella. Headwinds exist for all of them, albeit for different reasons, and differently for previously committed capital vs. new commitments. Namely, “buyout” typically connotes a debt-assisted purchase of a company. With interest rates now higher, and likely for the foreseeable future, such purchases have become structurally more expensive. We are witnessing acquisitions going forward without debt, which on the one hand shows deals can continue, though requiring more equity from the private equity sponsor. More expensive debt likely is an obstacle for both existing commitments to buyout equity and new commitments. Growth equity and venture, in contrast, typically do not lean on large quantities of debt to help fund an acquisition, but other headwinds currently exist – namely their public sector peers, or comps, have for the most part seen their share prices decline precipitously in 2022. These lower valued comps will force the growth equity and venture investors to match the valuations in their still private investments. This is likely a hindrance for existing commitments but should provide fertile investing landscape for new commitments here.
Private Credit
Looking forward, we think two considerations should dominate a client’s decision to further allocate to private credit: 1) With interest rates + ~450-500 bps off their lows for corporate credit, might it make sense to add some interest rate duration with fixed rather than floating rate loans? 2) With many analysts anticipating a recession, how resilient will private credit’s borrowers be, given that they are almost exclusively not rated by the credit agencies and are thus assumed to be below investment grade in credit quality? We think with distribution yields of 8-9%+, investors are being adequately compensated for the inevitable increase in defaults should a recession in fact appear in the near term, though choppier waters than the recent past should be expected.
Real Estate
Similar to the private vs. public marks in growth equity investing discussed above, we have observed significant divergence in performance and valuations between private real estate and their publicly traded comps in 2022. Toward the end of the year, headlines announced the suspension of redemptions for two of the leading private real estate funds. We think the mechanism built into these private real estate funds to suspend redemption provides the break necessary to reduce the risk of a broader systemic “run on the bank”, and as such, it is good for the ecosystem. While the near term may face speedbumps, we think the asset class remains attractive, earning 5%+ yields, managers deploying prudent amounts of leverage, and hopefully providing structural inflation mitigation.
Markets
Source: Morningstar and Bloomberg (data as of 12/31/2022)
- Equities rebounded in Q4, softening some of the blow from the first three quarters, but still finished down across style/size/region. Markets seemed to take earnings and mid-term elections in stride thanks to small signs of improving inflation picture and potential for a less aggressive Fed. Corporate earnings expectations continued to come down during the quarter, but they still reflect positive single-digit growth for 2022, translating to calendar year weakness coming almost exclusively from valuation multiple contraction. All but two sectors in the U.S. (energy and utilities) were down in 2022. The larger presence of those two sectors in value indices, along with significant weakness from some of the growthiest stocks of the past decade, helped value top growth by more than 20% for the year.
- Overseas stocks finished the year close to their U.S. counterparts despite the USD rising more than 8% for the year vs. a basket of major currencies. The dollar was at one point up nearly 20%, but then sold off in Q4. Adjusting out the local currency, many countries finished strong for the year, with the U.K. +7.1% as a prime example. Although the dollar strengthened against most, it was not all. A couple export-oriented countries (e.g., Brazil, Mexico, Peru) had currencies strengthen against the dollar. An aggressive Fed and global inflation have spurred many central banks (e.g., BOE, ECB) to aggressively raise rates, but they remained behind the Fed. With markets now thinking the Fed will slow, the others are catching up.
- Bonds finally caught a little reprieve in Q4, despite another round of Fed hikes. The yield on 10-year U.S. treasuries rose all the way to 4.25% in October (started the year at 1.5%), only to finish the year at ~3.9%. Spreads in more credit-oriented parts of the market narrowed in concert, helping most bonds post a positive Q4. The rebound, although helpful, did not save bond markets from their worst calendar year in modern history. The more interest rate exposure (a.k.a. duration), the greater the penalty in 2022.
- Alternative investments rebounded alongside traditional in Q4, but most of the story for the year was already written. Strategies with higher net exposures (to stocks or bonds) captured market downside while strategies with less directional bias showed better relative performance. Commodities ultimately finished the year in positive territory, though it wasn’t positive across the board. Energy and grain commodities (partly due to the war in Ukraine) were well into positive territory, whereas precious metals and industrial metals fell.


