We relayed a note in late February discussing the war in Ukraine, our thoughts, a few points on markets, and associated historical reactions to similar acts between nations. We will not touch on it again here but will repeat our sentiment. The loss of human life that has occurred and may continue in the coming months or even years is extremely tragic, and we feel for everyone who will be directly impacted. Discussing markets during a period of war is always secondary, but as stewards of capital for our clients, it remains a necessity.
Recap
It was the worst quarter for the U.S. Bond Market in over 40 years and as we all experienced, there weren’t many places to hide. Forty years is a long time and oftentimes it’s lost on people who weren’t around then, so for a bit of pop-culture context – for taxable bonds it was the worst since 1980 (when Empire Strikes Back was #1 in the box office, Call Me by Blondie led the pop music charts) and for municipal bonds the worst since 1981 (Raiders of the Lost Ark, Physical by Olivia Newton-John). We will touch on what’s happening in equity and other markets below our quilt chart, but given the headline, we think it best to spend most of this letter discussing bonds.
Then, as now, the bond sell-off came at a time when the Federal Reserve looked to quell inflation fears by raising interest rates. The Fed has a somewhat convoluted mandate “to promote effectively the goals of maximum employment, stable prices, and moderate long-term interest rates.” Today, employment is fairly stable, but prices are not. Since a mandate is a mandate, Fed interest rate rhetoric has turned quite hawkish (pointing to aggressive rate hikes to head off inflation). As an aside, we would highly recommend taking a look at our recent post, “Puncturing Inflation”, where we explain why inflation is not that easy to understand or measure, let alone target.
This hawkish tone has led market expectations for rate hikes to move quickly over the last six months. In October of last year, markets were pricing in one interest rate hike in 2022. We started 2022 with an expectation of three. Three months later, we are now seeing markets reflect between eight and nine hikes. It is not only market expectations. The Fed’s own meeting notes show an expectation for the Fed Funds rate to reach 1.875% by the end of 2022 (compared to a mid-December expectation of 0.875%). Notably, this is the first time in a while when market and Fed expectations for Fed Fund rates are in the same ballpark. Interest rates are up not only in the front end of the yield curve (which resides closer to the Fed Funds rate) but also in longer-dated bonds. Rising interest rates lower bond prices. So, if we know the Fed will continue to raise rates, why do we own bonds? As is typical, we will touch on that in the end, but first we wanted to provide the basic context of bond risk and where we stand today.
Interest Rate Risk (a.k.a. Interest Rate Duration)[1]
A quick reminder of bond math. For the sake of simplicity, let’s say you own a U.S. Treasury with 11 years to maturity that has a coupon and a current yield of 3% (current yield is coupon divided by current bond price). Interest rates rise and a year later, newly offered 10-year Treasuries are issued with coupon and yield of 4%. The price on your now 10-year Treasury (11 years minus the 1 year that just passed) must decline enough for your bond to yield the same as a newly issued one. Importantly, that price decline is not permanent. As the bond approaches maturity, you continue to collect $3 per year, and the price will move back to par (when you get your $100 back).
So, if not permanent, how much pain is left if rates continued to rise? Here we will point to historical context. First, going back to even the early 1960s, which means we are including the oil embargo-related inflationary spike in the mid-1970s and then another one in the late 1970s and early 1980s, we have yet to have a market where long-term bond yields have risen more than the Fed Funds rate. That means whether normal or hyperinflationary scenarios, rising rate environments come with a flatter yield curve. So even if the Fed gets to 3% on the Fed Funds rate (moving from 0% to 3%), there has been no precedent for long-term yields moving anywhere near as much. In fact, what often happens is that the Fed gets too aggressive, resulting in a curve inversion (longer dated bonds yielding less than shorter dated), which is subsequently followed by economic contraction and yields on the front end of the curve falling significantly (and ones on the long end falling, too). Curve inversions often do not translate into selloffs in equity markets, but that is a topic we will cover another time.
Second, with the exception of Paul Volker, who raised Fed Funds rates by more than 10% in a year (fighting 15%+ inflation), yields on long-term bonds (we will use the 10-year Treasury as a proxy) typically rise between 1.5% and 3.5% in a rising rate environment going back to the 1960s. We are currently 2% higher than the lows seen in July of 2020, so already very much in the middle of that range.
Last year, almost to the day, we shared our thoughts on “Fixed Income Investing in a Rising Rate Environment”. We highly recommend that those who are interested in learning how interest rates impact a bond position take a look at that piece. It walks through the basics of bonds in a rising rate environment, as well as the benefits of rates rising quickly rather than over time. The punchline – as long as one’s investment horizon is longer than the duration of their fixed income portfolio – is that they should be happy with rates rising, as this translates to higher expected returns going forward. We still believe that today.
Default Risk
This brings us back to what should be considered the main risk for bond owners – ultimately default. Fortunately, the recent weakness in bond prices has had no immediate impact and little impact on future expectations of default risk. Fundamentals in the municipal bond world are the strongest they have been for several decades. As an example, municipal rainy-day funds as a percent of expenditures are their highest level in over 30 years (12% vs. a long-term average of 4%). Although Federal Aid has helped states since the start of COVID, it has not all been largesse. State tax receipts are up nearly 14% YoY (the highest annual gain going back 40+ years), helping state budgets hit their highest surpluses since before 1978. On the taxable bond side, fundamentals are also quite strong. Despite concerns about inflation, U.S. corporations have been able to pass along costs and then some. Corporate profits continue to hit all-time highs, and U.S. profit margins are also pushing all-time high territory. Other areas of the fixed income markets are also doing well, with high yield debt and bank loans reflecting very low default rates, and asset-backed securities (think mortgages, car loans, etc.) showing very low current and low anticipated delinquency rates. We can see all of this with bond spreads[2] widening only marginally in Q1 compared to massive spikes seen in 2020 (COVID), 2016 (oil concerns), and 2011 (European banking and sovereign debt crisis). In short, markets are not reacting this way because of what is ultimately the biggest risk to bond owners, defaults.
Why We Own Bonds
We own bonds to generate income and to serve as a ballast during significant equity market dislocations. This time around, although stocks are down, they are down relatively little compared to the drawdowns of 2020, 2018, 2008, 2000, 1987, and beyond. Given our clients and their long-term investment horizons, we are actually happy to see yields on the rise. This sets bonds up to again provide a source of income and diversification during the next big equity market selloff.
Markets
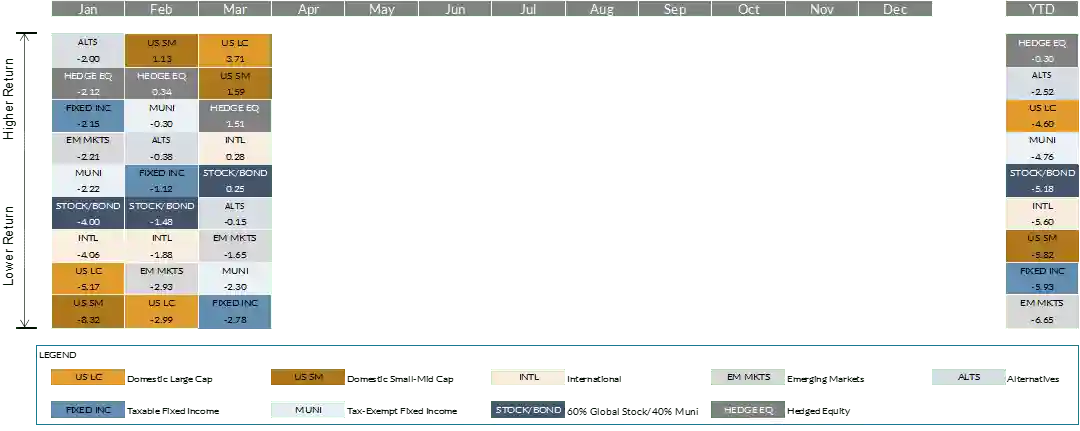
- Equity markets declined through the start of the Ukraine war, bottomed out in early March, and then recouped some of the losses by quarter end. Underneath the relatively benign index numbers there were significant dislocations. Large cap value stocks led growth by nearly 10% thanks to a rebound in more commodity-exposed areas, specifically energy. Growth was also hampered by more than 30% selloffs in names like Netflix and Facebook. Companies with the lowest earnings growth over the past 3-5 years and the highest dividend yield outperformed in the first quarter. In the small-mid cap space, value and growth discrepancies were even wider, with smaller U.S. biotechnology and life science companies (largely in growthier portfolios) down more than 20%. Other areas of pain included industries most impacted by supply chain bottlenecks like household durables (-26%) and building/construction materials (-21%).
- History has shown very little correlation between interest rate movements and leadership between value and growth. We can see data going back to the late 1970s showing that dynamic. Despite this, a common refrain in the market over the past few quarters is that growth stocks should be punished more in a rising rate environment. This is because growth valuations are based on cash flows further out into the future as compared to value stocks, and therefore they should be treated as longer duration assets. It will be interesting to see how this view evolves in the coming quarters. Growth stocks are also significantly less indebted than their value counterparts, so if rising interest rates ultimately become an issue for balance sheet management, the refrain may evolve. The growth and value story played out the same way outside the U.S., with energy stocks (excluding Russia) leading returns. European stocks lagged with those closer to Russia/Ukraine geographically and economically down more (e.g., Germany -13% vs. 2% for UK). In emerging markets, outside of Russia (which has now been removed from most benchmarks), China was amongst the worst performers (-14%) thanks to new COVID-related closures in parts of the country. Brazil (+36%) on the other hand benefited from large exposure to commodity exporters.
- Duration was punished across the fixed income space. Within municipal bonds, higher quality actually outperformed with AAAs outperforming BBBs and high yield municipal bonds. Within the taxable space that was not the case. Amongst the best performers were lower non-investment grade floating rate loans in both the liquid and illiquid space, as well as shorter duration high yield bonds. Much of the weakness came from investment grade corporate bonds, which tend to be longer duration compared to treasury and mortgage-backed markets.
- Alternative investment performance for the quarter can again be summed up by the level of equity and fixed income exposure. Those with higher equity exposure lagged, though funds with value tilts held up better. Those with more fixed income exposure (especially interest rate risk and foreign debt) fell, especially any funds with notable Russia exposure.


